



How Americans Will Spend Money for the 2026 Holidays
What Sellers on Etsy, eBay, and Amazon Need to Learn from These Numbers
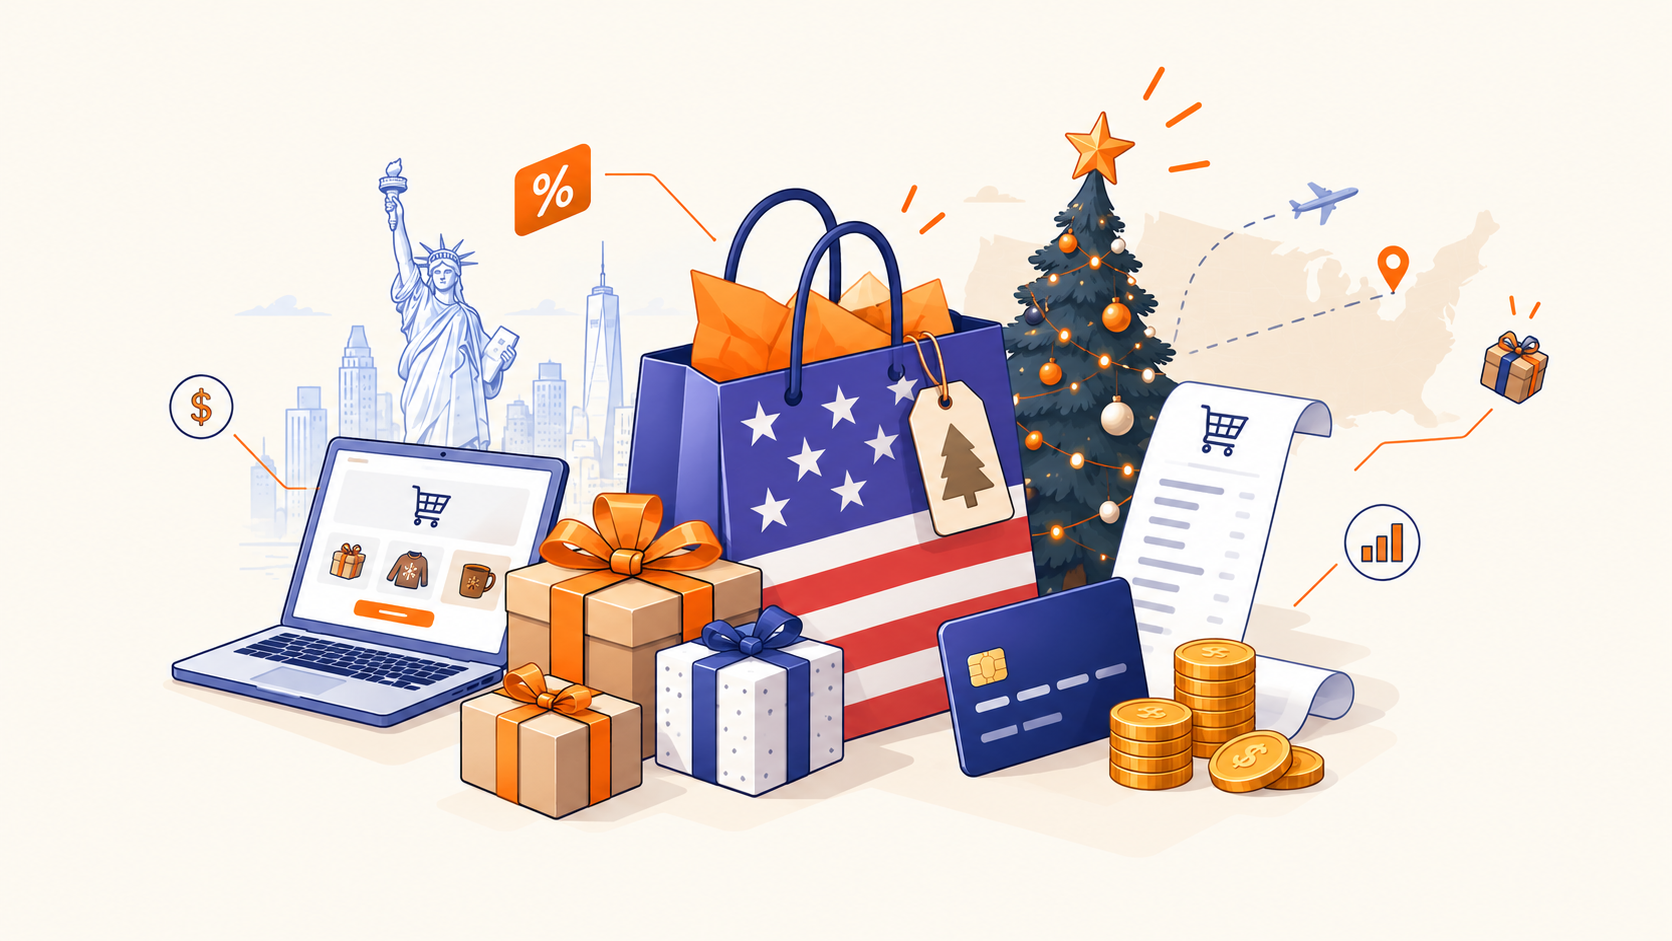
Americans are not skipping the holidays. Instead, they are cutting down the number of items in their carts and being much more deliberate about each purchase. According to a study by Basis ImpactIQ and GWI (2,006 respondents, fieldwork conducted in May 2026), 72% of US adults plan to buy gifts, 56% will spend about the same as last year, and 35% plan to spend more. Data from The Penny Hoarder (1,000 respondents surveyed via Pollfish on August 8, 2026) reveals an average anticipated holiday budget of $818, with 77% altering their shopping habits due to price increases.
For sellers shipping goods to the US, the dollar figure itself is not the critical takeaway. What matters most is that gift lists are shrinking, while the purchase decision for every individual item is taking longer and undergoing far closer scrutiny.
Two Studies, Two Perspectives—and Why They Shouldn’t Be Mixed
The data here comes from two distinct consumer surveys with fundamentally different methodologies.
Basis ImpactIQ x GWI polled 2,006 consumers in May 2026, with the sample weighted to match the US adult population. This study focuses on shopping behavior: when people buy, where they look for ideas, and how they evaluate retail offers.
The Penny Hoarder surveyed 1,000 American adults on August 8, 2026, via Pollfish, using post-stratification weighting across age, gender, geographic region, and income. This study tracks financial strain: debt levels, consumer anxiety, and budget flexibility.
A three-month gap and differing approaches yield contrasting pictures. In the Basis survey, only about 10% plan to spend less on gifts. In the Penny Hoarder study, that figure reaches 30%. The wording also diverges: Basis asks specifically about gifts, whereas The Penny Hoarder measures total holiday budgets, covering groceries, travel, and home decor. Use Basis to analyze buying habits, and turn to The Penny Hoarder to assess consumer sentiment and financial boundaries. Do not blend percentages from both reports in the same sentence.
How Much Americans Plan to Spend
The average expected holiday budget for 2026 stands at $818. This covers the entire season: gifts, food, parties, travel, decorations, and charitable donations. Gifts represent the largest expense category. 26% anticipate spending $1,000 or more, while only 3% plan neither to celebrate nor spend at all.
Compared to 2025:
- 56% will spend roughly the same amount on gifts (Basis)
- 35% plan to spend more, including 7% who will spend significantly more (Basis)
- About 10% plan to spend less (Basis)
- 34% expect their overall holiday spending to rise, while 30% expect it to drop (Penny Hoarder, total holiday budget)
Rising holiday budgets are not driven by consumer optimism. Among those planning to spend more, 64% point to higher prices on standard gift items caused by inflation and geopolitical trade tensions. In The Penny Hoarder survey, 42% of this group state plainly that they are simply paying more to get the exact same items as last year.
Among shoppers scaling back, the primary drivers are saving money due to broader economic anxiety (47%), shifting money toward other financial priorities (44%), and general uncertainty about the future (39%).
Inflation Is Reshaping Cart Composition, Not Stopping Purchases
Despite this, gifts and holiday celebrations are the absolute last categories consumers cut. Only 4% cited gifts as their primary area for budget reductions this year. They cut elsewhere: groceries (56%), fuel (46%), utilities (31%), and dining out. Popular money-saving tactics include switching from name brands to generics (57%), delaying major purchases (48%), and shopping at discount retailers (46%).
Certain categories remain non-negotiable. 46% will buy gifts for their children regardless of budget constraints. Other priorities include gifts for immediate family members (37%) and partners (35%). Only 13% say they are unwilling to exceed their budget in any category.
The economic backdrop: US consumer prices rose 3.4% year-over-year in July 2026 according to the Bureau of Labor Statistics, driven by fuel costs and import tariffs amid broader trade disputes. 51% of Americans report that rising day-to-day living costs cause their highest financial anxiety heading into year-end. 53% carry a revolving credit card balance, and 17% are still paying off debt from the 2025 holiday season.
The practical takeaway: Gift lists feature fewer slots, but expectations for every chosen gift are considerably higher. This season will not be defined by cheaper products, but by fewer, far more selective purchases.
The Shopping Season Kicks Off in September, Not November
The holiday shopping window in the Basis study extends from September through late December. Hanukkah stretches from October through December, Diwali covers October and November, and Kwanzaa spans November through January.
- 68% begin shopping earlier specifically to avoid shipping delays
- 34% notice they start earlier with each passing year
- 57% shop year-round to capitalize on deals
- 25% deliberately spread purchases over time due to current events
- 38% will complete the bulk of their shopping before Black Friday (Penny Hoarder)
"To avoid delivery delays" is the key phrase here. Delivery timelines are already wired into consumer habits: shoppers avoid waiting until December because they simply do not trust peak-season logistics.
Black Friday Is No Longer the Make-or-Break Moment
56% plan to shop during Black Friday and Cyber Monday sales events, 23% do not, and 21% remain undecided. However, 54% note that the long holiday weekend is no longer essential because promotional discounts run all season long. Another 9% will skip the weekend entirely because their shopping lists will already be completed by then.
The Penny Hoarder reports higher numbers: 62% plan to shop around Black Friday, and 42% around Cyber Monday. The questions were framed differently, so these results do not contradict each other. Both datasets point to the same reality: a single promotional weekend no longer covers the holiday sales season.
How Shoppers Evaluate Value
Shoppers use several key factors to decide whether an offer is truly worth buying:
Free shipping ranks right alongside customer reviews and nearly matches final price point. It is not viewed as a nice-to-have perk—it is an active filtering criterion used to reject listings.
Deal hunting is not universal: 26% of all buyers plan to search more actively for bargains. However, among shoppers feeling the squeeze of current economic events, that figure jumps to 57%. Among those actively changing their seasonal approach, 57% will search harder for discounts, 33% will establish stricter spending limits, and 32% will wait to see if prices drop further.
Decisions Are Deliberate, Not Impulsive
39% of Americans say at least three-quarters of their holiday purchases are planned in advance. Another 43% maintain an even 50/50 split between planned purchases and spontaneous finds. Only 1% describe their holiday shopping as mostly impulsive.
Roughly half of all buyers take a pause ranging from several days to several weeks. During this window, your listing must remain in stock, and your product page needs to stand up to direct side-by-side comparison with competitors.
Where Wishlists Form: Search, Social Media, and AI
71% of Americans used at least one digital tool to find gift ideas in 2025.
Leading social platforms include Instagram (21%), Facebook (20%), Pinterest (16%), and TikTok (15%). Top AI discovery tools are ChatGPT (12%) and Google Gemini (12%).
Direct in-app social commerce remains a niche, but it is expanding: 11% bought gifts directly within social apps in 2025, while 19% express interest for 2026. Among those open to social checkout, the preferred platforms are Instagram (50%), TikTok (50%), Facebook (43%), and YouTube (32%).
Regarding AI usage: 17% definitely plan to integrate AI into their holiday shopping, 23% remain open to it, bringing overall openness to 40%. Intended uses focus on finding discounts (51%), brainstorming gift ideas (44%), and comparing products (44%). The final checkout decision is almost entirely handled by the buyer.
Shopping format remains predominantly hybrid: 42% shop equally online and in-store, 34% shop mostly online, and 9% shop exclusively online. Among digital shoppers, 80% buy via desktop or mobile web browsers, while 42% order through retail mobile apps.
What Sellers on Etsy, eBay, and Amazon Must Understand
These figures capture US consumer habits, but each data point translates into a clear operational directive for international merchants shipping from overseas.
1. Stock Must Be in the US Before the Season Starts, Not in Transit
68% of Americans buy early to avoid shipping disruptions, and 38% finish most of their list before Black Friday. Peak demand arrives while standard international parcels from Europe are still stuck in transit. Sellers who start shipping inventory in November compete for end-of-season scraps rather than the main shopping rush.
2. Shipping Is an Elimination Filter, Not Just a Checkout Line Item
40% of shoppers judge an offer by the availability of free shipping or added delivery perks—nearly matching the 42% who focus on final price. A listing featuring paid international delivery and a two-to-three-week transit time fails two out of three buyer criteria before the shopper even inspects the product.
3. Fewer Cart Slots Mean Harsher Competition
46% of consumers will buy fewer items and 26% will shorten their recipient lists, yet total spending holds steady. Flooding a shop with broad, cheap catalogs is far less effective than highlighting a curated selection of standout listings built to win side-by-side comparisons.
4. "Meaningful Gifts" Play Directly to European Sellers' Strengths
54% of buyers prioritize finding something personal and meaningful over staying strictly within budget (18%). Among affluent households, this gap widens to 62% versus 10%. Handmade craftsmanship, small-batch production, custom personalization, and authentic brand heritage match this demand. However, that advantage only converts if delivery matches domestic speed and convenience.
5. One Order Often Covers Multiple Recipients
39% buy gifts for 4–6 individuals, 23% for 7–9 people, and 20% for ten or more. Among parents, the numbers rise further: 93% buy for their children and 69% for their partner. Product bundles, gift sets, and tiered multi-item orders directly lift average order value (AOV).
6. Product Lines Must Outlast the Comparison Window
One-third of buyers deliberate for several days, while 12% conduct extended research. If an item runs out of stock mid-comparison, you do not just lose a single transaction—the listing falls out of consideration permanently. Keeping inventory positioned domestically avoids stockouts caused by one-off international replenishment.
7. Brand Discovery Happens in September and October
Search engines, social media feeds, and AI assistants populate consideration lists long before a customer clicks "Buy." Optimization work, seasonal content, and promotional ad campaigns launched in November arrive long after the buyer has finalized their shortlist.
How Fulfillment and Consolidation Fit the Picture
The data exposes a central friction point: American buyers make decisions early and expect prompt, low-cost domestic delivery, yet European merchandise is physically stranded across the ocean.
Bridging this gap requires a two-part operational model:
Consolidation involves shipping products into the US as a single bulk freight batch instead of hundreds of individual, fragile cross-border parcels. It replaces fragmented tracking with one streamlined logistics movement, unified customs documentation, and predictable warehouse arrival windows.
US-Based Fulfillment handles domestic warehouse storage, kitting, packaging, personalization, pick-and-pack operations, and immediate dispatch to end buyers via local carriers. The customer gets domestic shipping times; the merchant gets to compete on delivery speed without being filtered out at checkout.
Who Benefits Most from This Strategy:
- Sellers with steady, predictable monthly order volume rather than sporadic sales
- Businesses with clear seasonal sales peaks that can be modeled in advance
- Stores where orders frequently contain multiple bundled items
- Multi-channel merchants selling across Etsy, Amazon, and eBay who need a centralized inventory hub for all channels
Key Metrics to Evaluate Before Committing: Calculate optimal upfront inventory quantities, freight transit timelines to the US facility, monthly warehousing and storage costs, and a clear clearance strategy for unsold post-December stock.
Was the article useful to you?
Blog
These articles may also
be helpful to you
Jun, 2026
How to Prepare Your Etsy Shop for Scaling: Logistics, Production, and Delivery
The most successful sellers build a framework capable of supporting future business expansion well in advance

Jun, 2026
Oleh Ladan, SkladUSA: “We Help Ukrainian Businesses Sell Worldwide”
Oleh Ladan, founder of SkladUSA, was a guest on the YouTube channel Young Business.



Feb, 2026
Preparing Your Etsy Shop for Saint Patrick's Day 2026: What Has Changed and How to Se...
From Vibrant Green to Patina Blue, From Print to Embroidery: Adapting to New Trends and Ensuring On-Time Delivery

Jan, 2026
U.S. Professional Holidays: The "Quiet" Calendar That Can Boost Your Etsy Sales
In the United States, expressing gratitude to those who "stand on watch" has long been a cultural cornerstone—and on Ets...
Jan, 2026
SkladUSA as an Etsy Shipment Partner: How Ukrainian Sellers Can Deliver Faster to the...
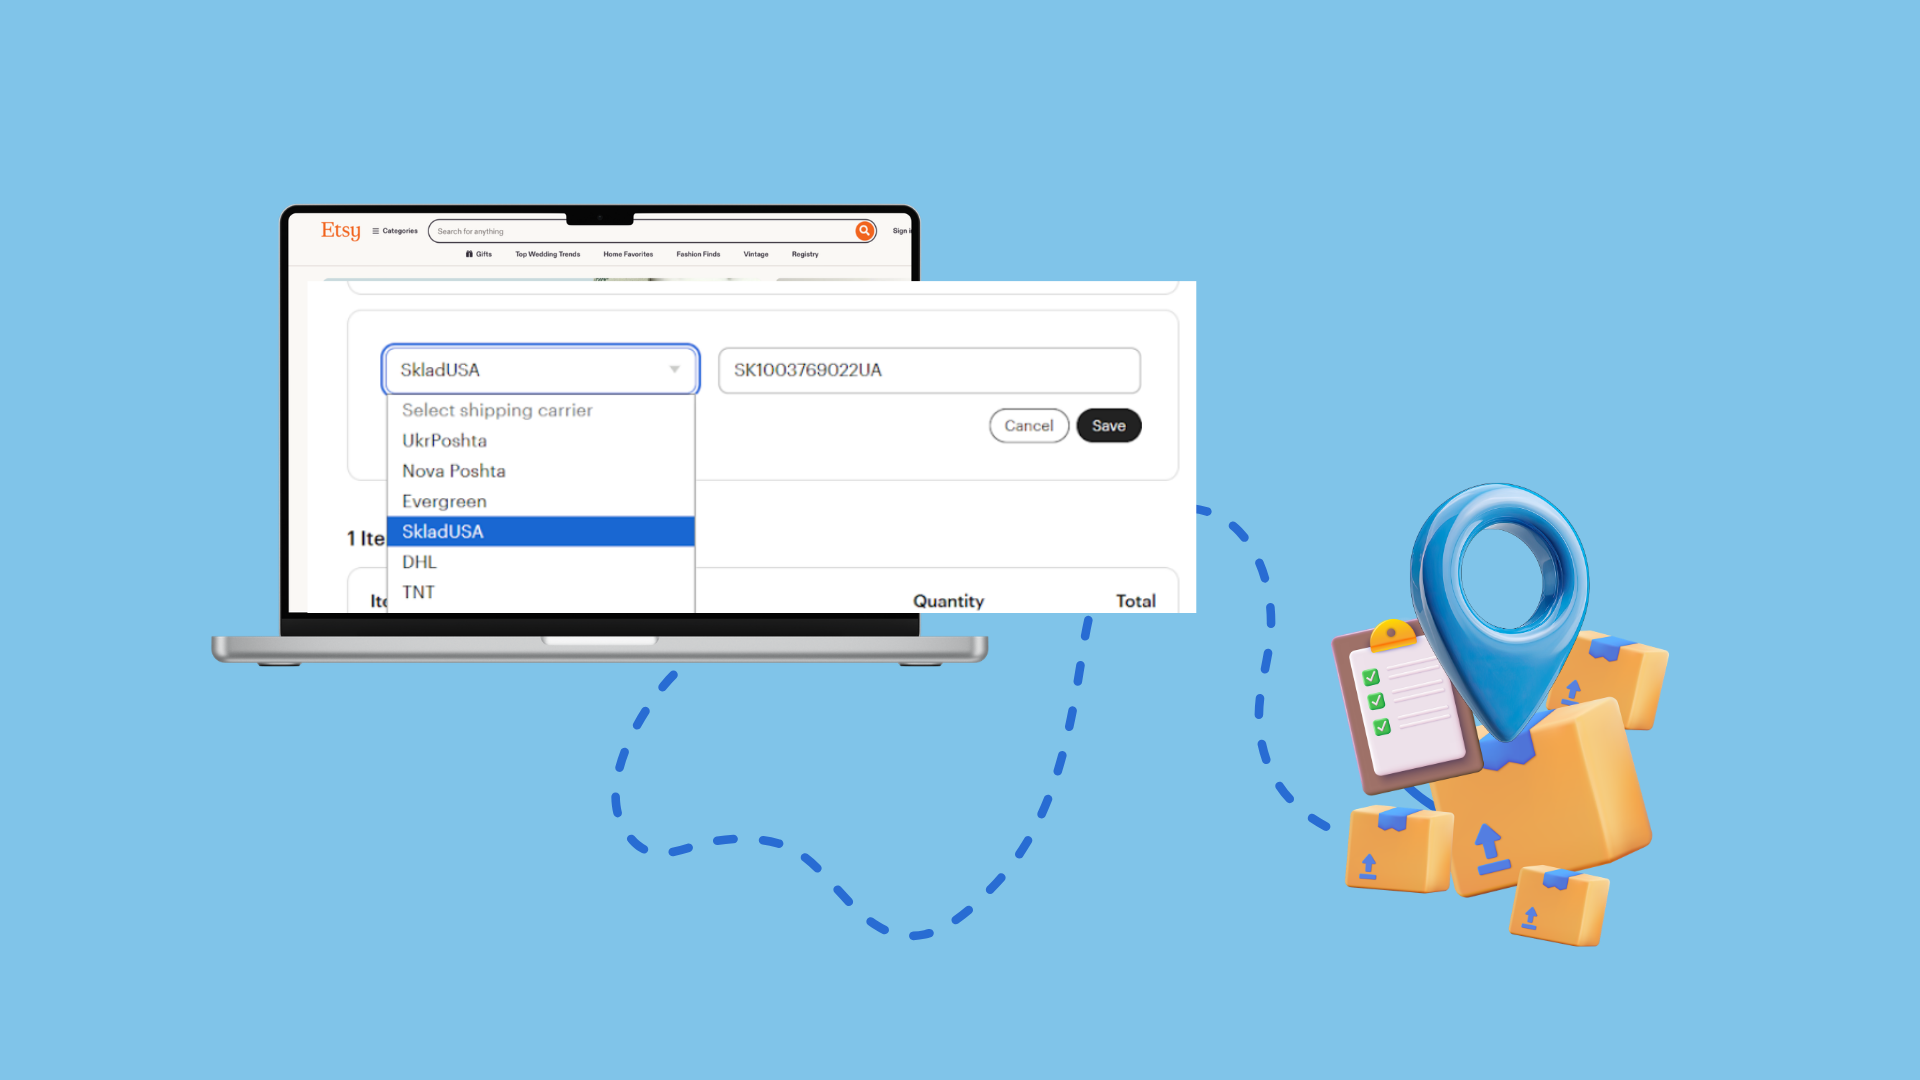
Etsy officially supports SkladUSA as a third-party shipping service for shipments from Ukraine
Jan, 2026
Why Pinterest is Vital for Etsy in 2026
Pinterest Predicts 2026 for Etsy: How to Boost Sales While Others Are Still Catching Up

Jan, 2026
How to Boost Etsy Sales for Valentine’s Day 2026: Trends, SEO, and Shipping Strategie...
In 2026, Valentine’s Day is about much more than just "couples." We break down how to capture new shopping behaviors, pr...

Sep, 2025
Mureli: From First Orders to a Premium Brand. How Partnership with SkladUSA Transform...
In this interview, Sviatoslav shares how SkladUSA’s logistics support helped the brand evolve from a small startup into...
Why is the article not useful?
Thanks for sharing your opinion. Please help us improve this material.
The article is not useful because:
Thank you!
Your opinion is very important to us.